A couple of weeks ago I was researching some Vega stuff (remember, Vega is the charting package I use for the site) and I found a reference to some software called D3. D3 is software that’s used to transform raw data to data for visualisation, and Vega is heavily based upon it. I don’t know the exact boundaries between the two. So I was reading about D3, and I found mention of a book called “Semiology of Graphics”, which is apparently a seminal work in the area. So I went to Amazon and bought a copy.
It arrived on Thursday. It’s a massive heavy book, like the Edward Tufte books, and it’s rather more academic than I anticipated. Because y’know, a book about semiology was always gonna be light reading, wasn’t it? Even before I sat down to read it I got an idea for a graphic for the site, so I grabbed a blank note book and a pen and started reading Semiology of Graphics.
So far I have got past the bit where he defines the terms he’s going to be using. Oh goodness I hope I am past that bit. However I have about 7 pages of ideas so far. I hope I am getting to the good bits soon.
Certainly I’m thinking about the data that the site displays in a different way. Geeks and games are qualitative data – they are incomparable and unordered. However they can be classified – geeks from Australia vs those from Germany, games which won the SdJ vs those which use Dice Rolling.
On the other hand, ratings and numbers of plays are quantitative data – they can be sorted. The quantitative data are used to describe the relationships between the geeks and the games. There are also a few dates involved, which are quantitative data as well.
I guess the site is about illustrating the interplay between the quantitative and qualitative data, particularly with the qualitative data being used to place the games in 2D space. Or, as the book points out, in 2D space with a variety of techniques being used to illustrate further dimensions of the data.
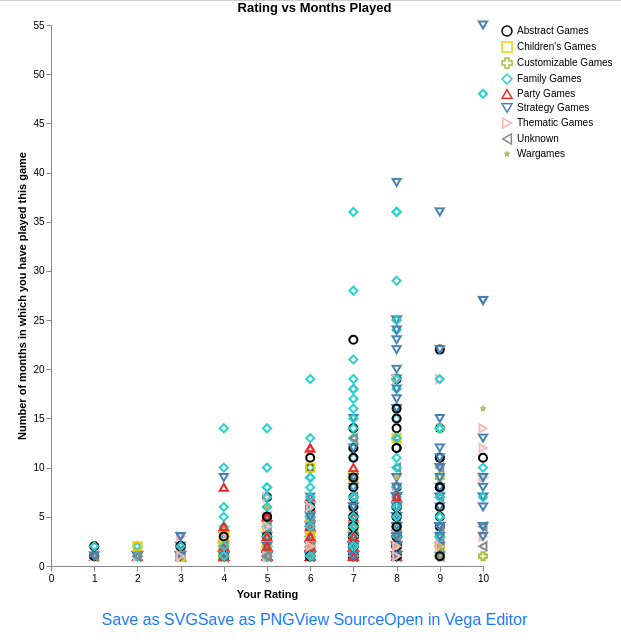
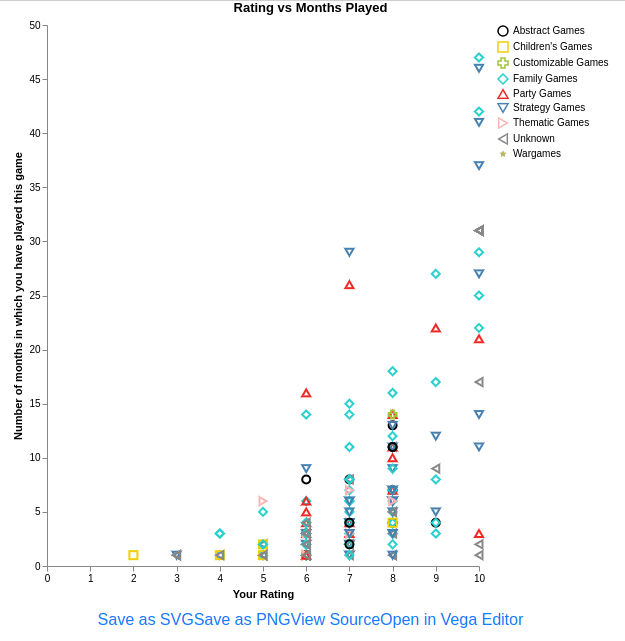
The image is the new version of the Rating vs Months played graph. The shapes and colours mean the same thing, because of colour-blindness. The chart illustrates that the games I keep coming back to are family games and strategy games. The family games are sort of a light strategy genre, so it seems that’s what I’m like. The same graph for cyberkev63 (shown below) has much more prominent red triangles for party games, which he is well-known for.
So that’s where the Semiology of Graphics has got me so far.
This weekend I’m off on a trip to Europe (not for Essen, as far as I know), so I will be distracted for a couple of weeks. I wish life would not get in the way of the development of the site! I guess the original site evolved over a few years, I should not be so impatient that the all-new even-better site is taking some time.


