Ho Ho Kill Me Now

This Christmas season, I am being, as usual, as unChristmassy as I possibly can. Quite apart from work never actually stopping for me, and this being a busy time of year, I’m a grumpy old man. However as this blog is not about my misanthropy, let me tell you about the code I’ve been writing.

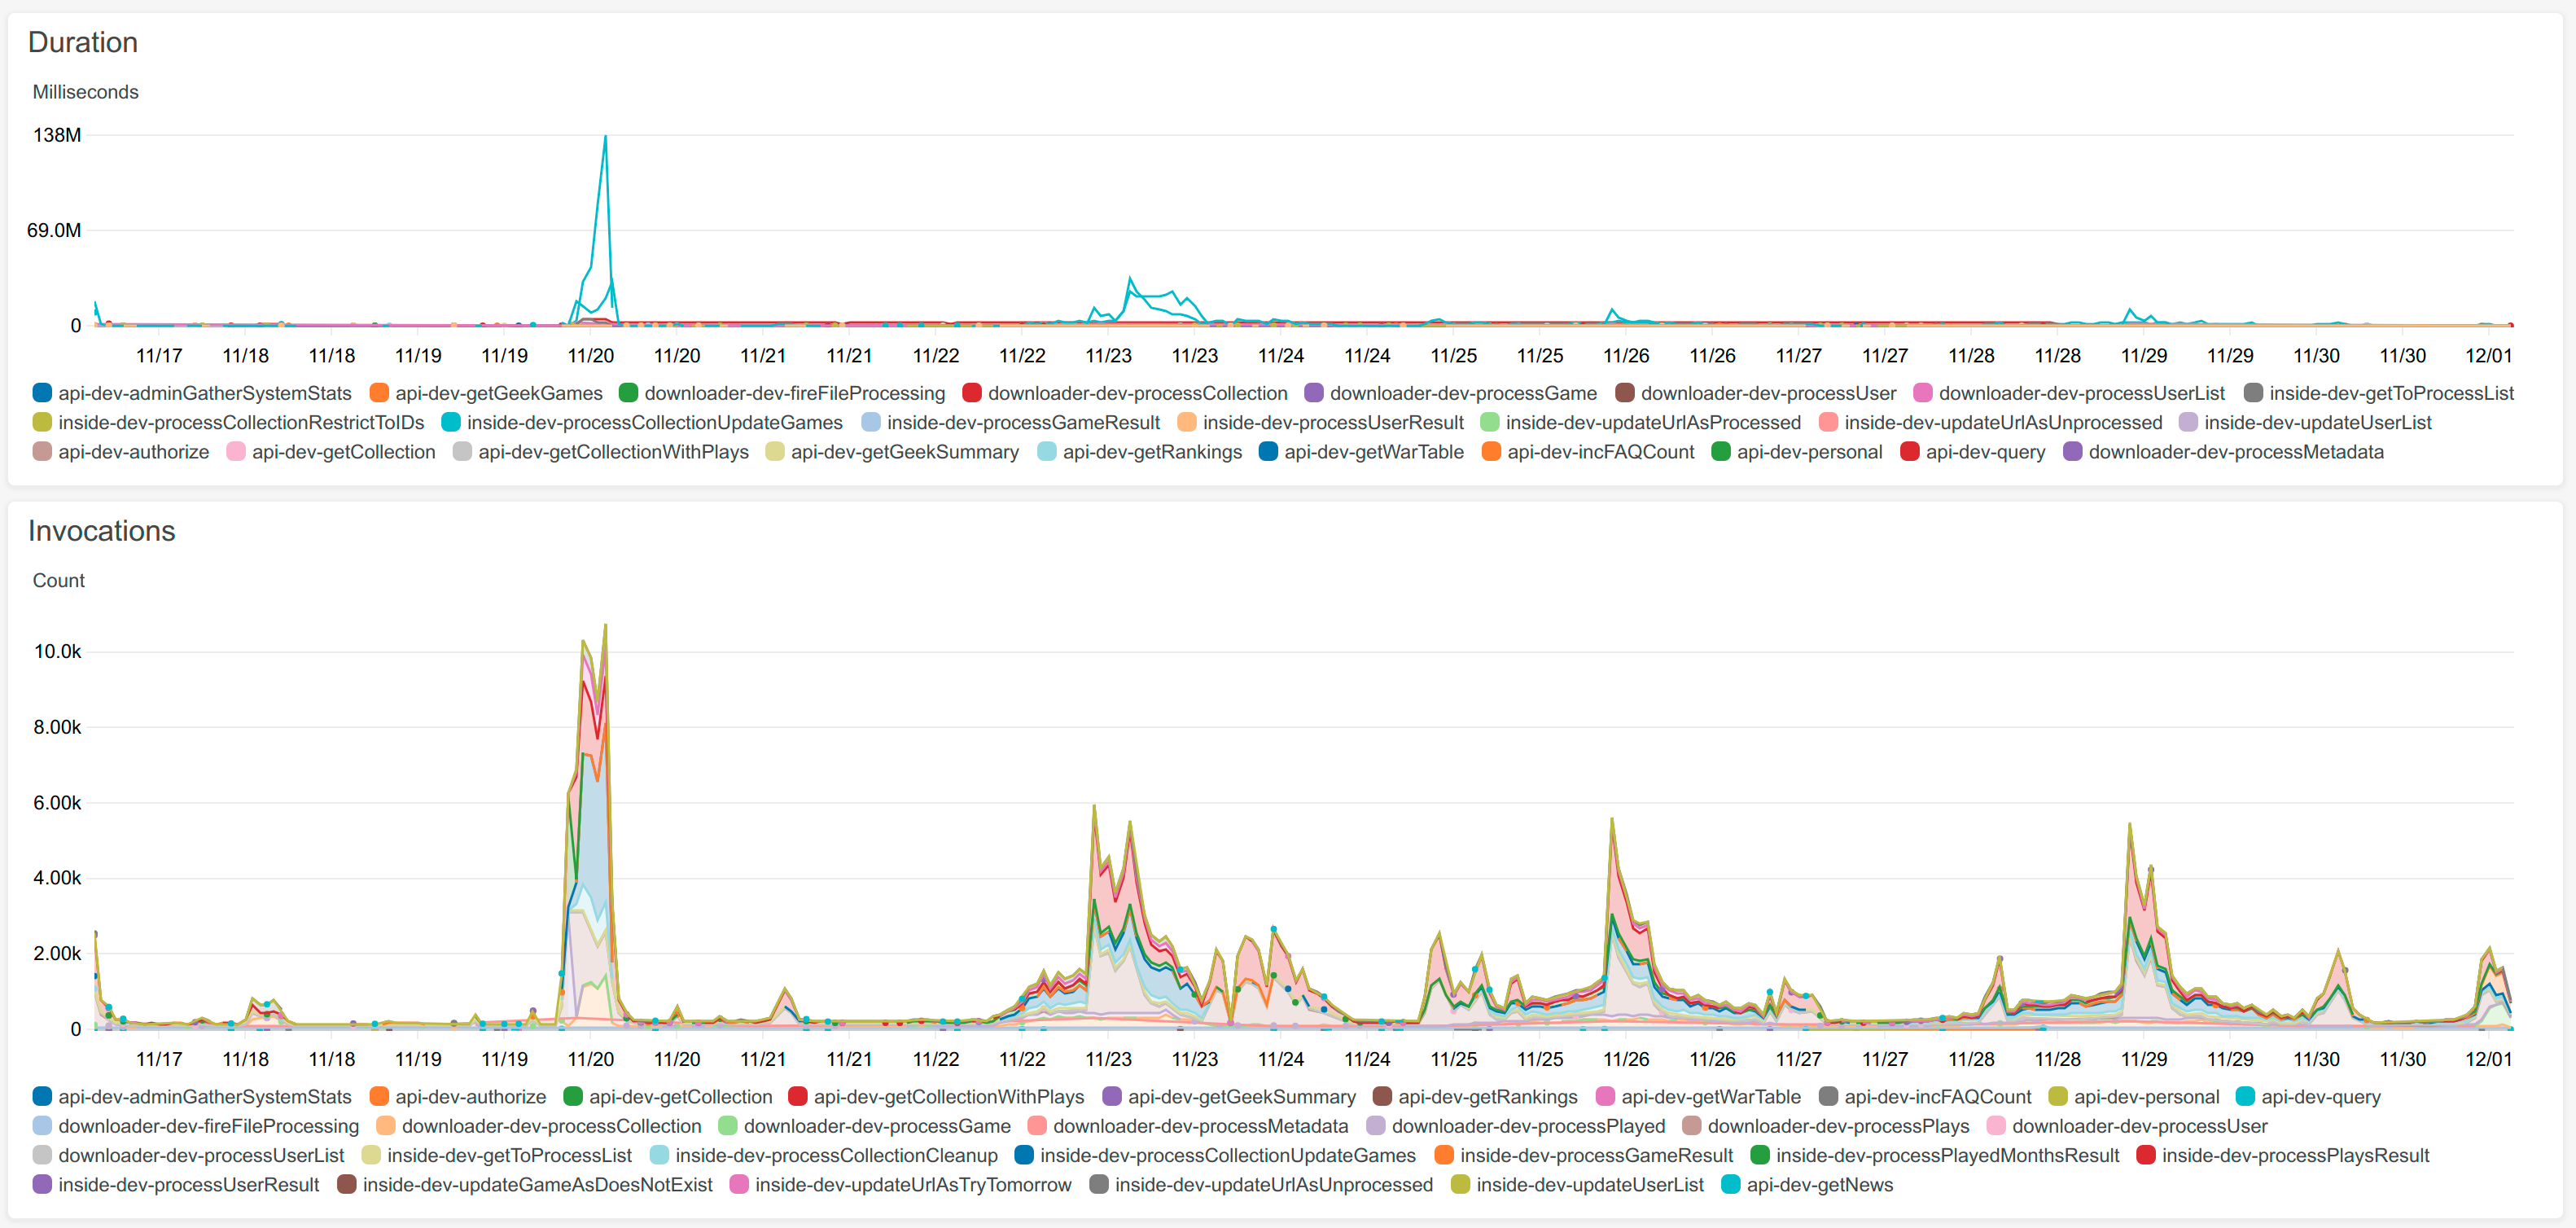
On December 1 (oh my goodness, so long ago) I showed off the component I had got going which allowed you to enter a list of geeks. I also complained about Angular Material. Since then I’ve been working on the user data page, and maintaining the love-hate relationship with Angular Material. Mostly hate.

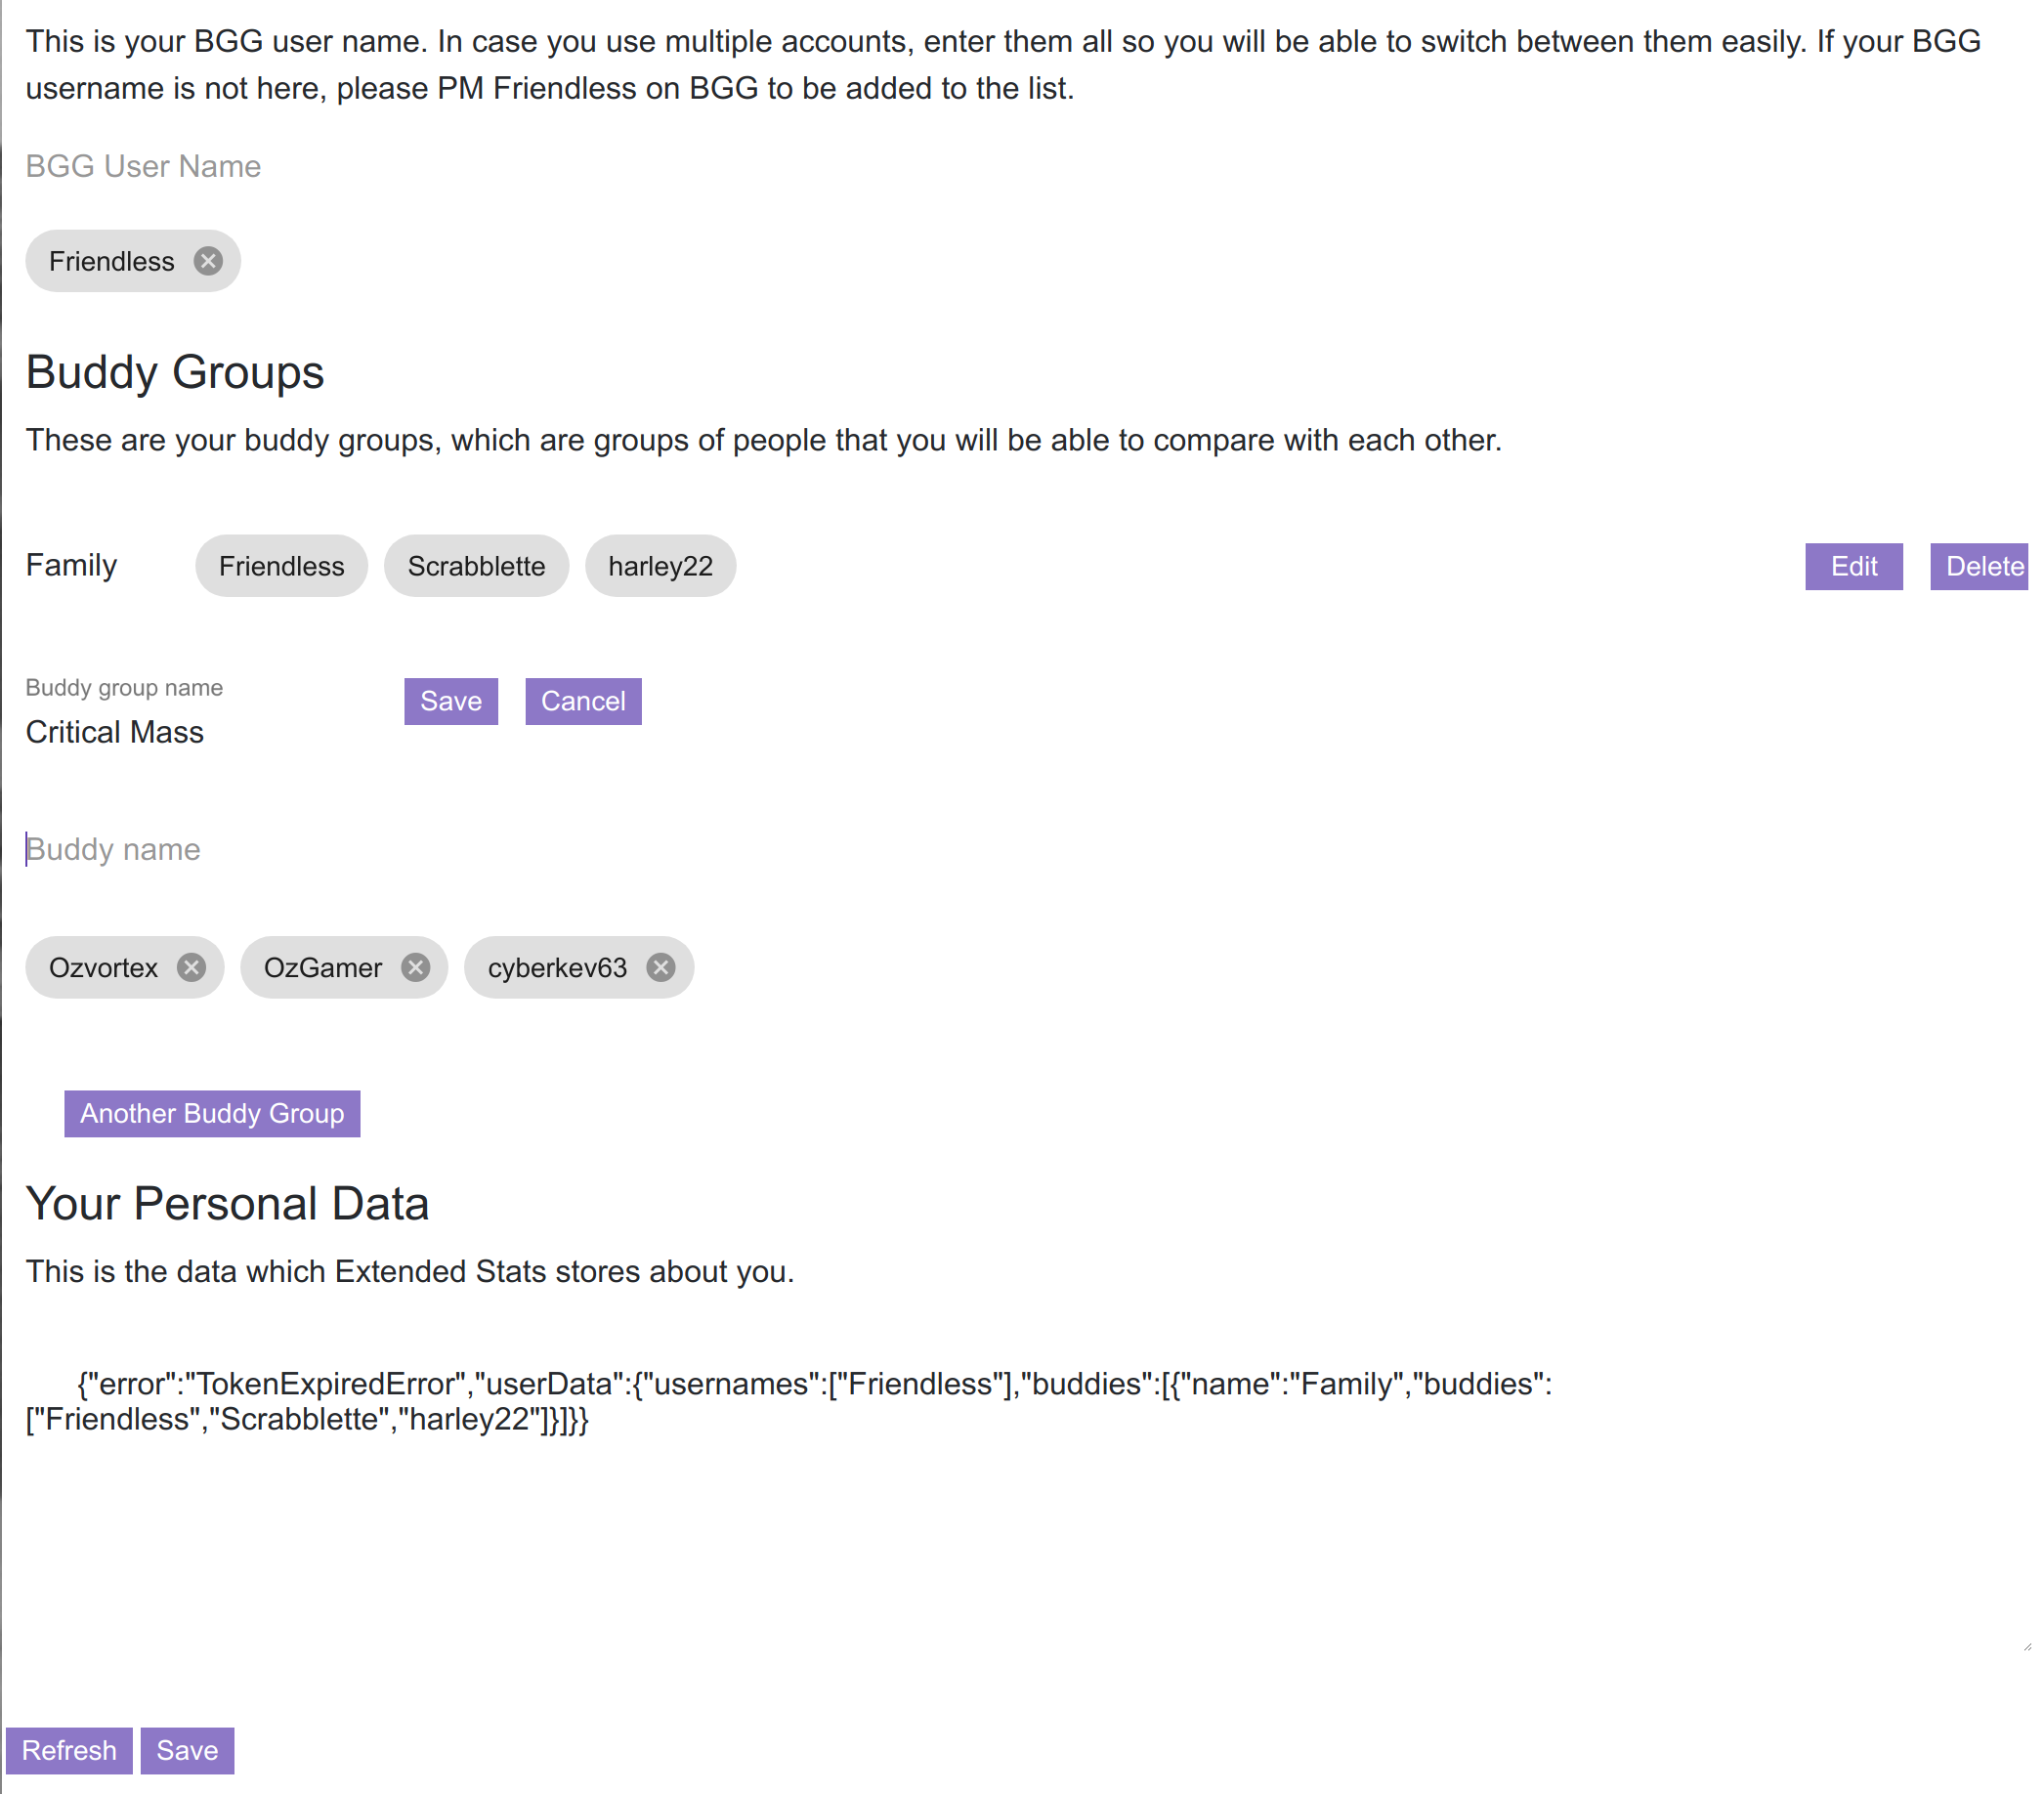
The user data page does two things – it allows you to edit data attached to your login on Extended Stats, and it tells you what that data is. The first is obvious, the second is my interpretation of a GDPR requirement. It might seem silly, but I kinda believe in what GDPR is trying to achieve and want to build accountability in from the ground up.

Now, editing the user data. The first thing you can edit is your BGG user name. As anyone can see the data on Extended Stats relating to your BGG user name, even without being logged in, you don’t need to fill that in. However my intention is that when you’re logged in, I’ll give you hyperlinks to the pages for that BGG user. And in fact, you can have multiple BGG user names, which will be convenient if you maintain stats on behalf of your spouse or your board game group.

Then there’s buddy groups. A few years ago I made this graph of new games played over time for my local gaming group. And I want so badly to be able to provide this graph to all of you!

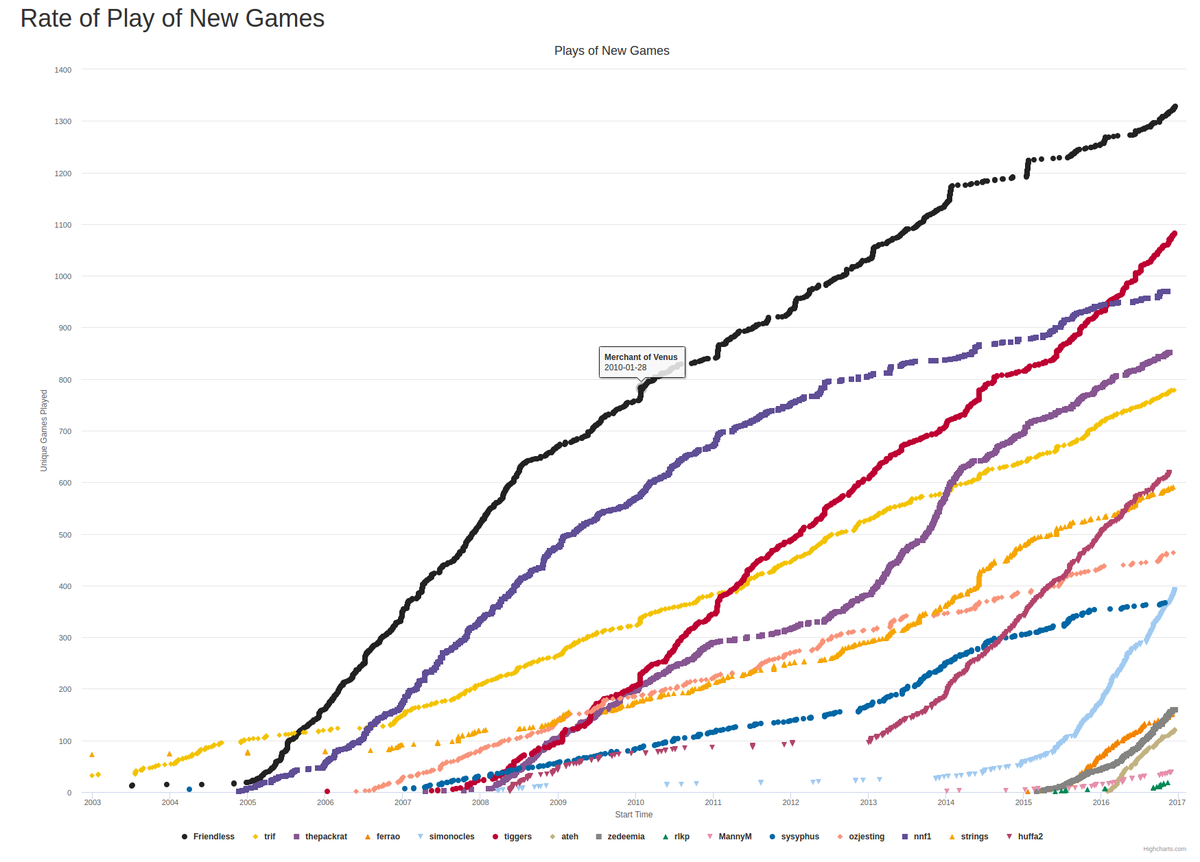
So the plan is that this sort of graph will apply to a group of geek buddies. And to save you entering that group of geek buddies every time, I will store it in your account. And if you want to do it for your other gaming group as well, you can create a different buddy group.

Sadly, the work on the user page is still not complete. However most of the wrangling with Angular Material seems to be over, and I have to connect the results to the database. As the authentication system refuses to work with the test system, I need to test that out on the real system, which is kind of painful. So, work continues at its usual crawl.

Jack of the Beanstalk

I was away last weekend on Family Business, so I just let the site run, with the beanstalk going. The bill for November arrived, showing a dramatic increase in EC2 (virtual server) costs.

I’ve been very slack about posting about costs (because it’s so boring), so I made a (quite bad) chart of the components of the costs over time (the last 5 months). In July, the Cloudwatch  costs were high, because I was doing too much logging, and I fixed that. In September and October the Lambda costs were high, so I brought in Elastic Beanstalk to fix that. In November the EC2 costs were high because of the Elastic Beanstalk, so today I tried to fix that.

The reason Elastic Beanstalk is expensive is because it adds another server – so now I have two servers, one for Express and one for the blog – and that has a certain fixed cost. But then there’s another machine called the load balancer, which decides which of the Express servers will handle the request. In my scenario, the load balancer seems like an unnecessary luxury, given there is only one Express server. So at $8 for the month, that had to go. The virtual machine that Express runs on was more expensive than it needed to be, too, so I decided to make that an even smaller one. Those changes should save more than $10 / month.

AWS Costs Over Time

Of course it wasn’t that easy. One of the nice things that Elastic Beanstalk does for you is create the server environment that the application runs in, so I had to redo that bit myself. So today I learn how to create an Application Machine Image,  how to deploy my Express application onto a server, and how to run an Express server with permissions to use port 80. The last bit was much harder than it deserved to be.

So apart from this recurring trauma, the site is going quite well.

Database performance over the last 4 weeks

The dithering of the updates has really evened out the load on the database, so now the database WHICH IS COSTING ME $30 / month looks like it might actually be able to do its job for a while. The AWS database service seems like extraordinarily poor value. On the other hand, it does backups and stuff for me.

No more slow Lambdas!

The Lambda performance issues seem to be fixed for the moment as well.

It looks like it might be time to write some functionality.

And Another Thing

So after arguing with Angular Material for most of the day, to the great disgust of my dog, I got this going:

It’s for editing your geek buddy list. Angular Material looks quite nice, when I can get it to work. I also quite like this idea of integrating demos into the blog posts. On the other hand, the demos are useless if I don’t then go put them into something on the site.

It’s Always Darkest Before the Dawn!

Well, after a week where everything was broken, I’ve made some progress. First of all, the big laptop got repaired and is better now. That means I could get the autocomplete demo from it, and then I was able to fix the bug in the web site deployment script (by abandoning the bit that mysteriously broke). That means the autocomplete demo is working, and here it is. Type someone’s geek name in:

That’s running against the Elastic Beanstalk server that I was waffling about a couple of weeks ago. So that’s all good. Next I have to remember why I was doing that.

Now I have also been working on the downloader performance, and there’s some good news about that too. I found a couple of places where I could do multiple database inserts in one transaction, and that has made a great difference. Here are some graphs of database performance over the last 2 weeks:

Database performance over the last 2 weeks

In the bottom right graph, notice that the green line has stopped bottoming out. That causes no more spikes in the bottom left graph, which is good because those are essentially site breakages. And the top two graphs show how the load on the database has spread out a bit.

This change in behaviour is also obvious in the Lambda performance graphs.

Better Lambda performance

The nasty spikes in the top graph have gone, which is good because I think those are the ones which cost me money. In the bottom graph, the load seems to be continuing to flatten out, which is also a good thing.

OK, now I’ve solved those problems I really should get back to doing whatever the site was intended to do.