I went to a MongoDB meetup a couple of weeks ago. I don’t use MongoDB, but I do like the meetup and I do think I need to know about NoSQL databases. There was a talk about MongoDB Charts, which looks like a pretty whizzy product if you use MongoDB. I was particularly impressed by the pretty charts, so I had a chat to the speaker afterwards, and he told me that they use Vega, and that I could too. So I put that on my list of things to do.
Now having spent way too many days writing code for the site that was not very cool, I decided to spend today trying to shoehorn Vega into the site. It looks like it worked!

If you want to try it yourself, the place where it definitely works at the moment is http://test.drfriendless.com/favourites.html?geek=Friendless. test.drfriendless.com is like extstats.drfriendless.com but without the https – the content distribution network which gives me the s in https also caches my pages all over the world, and it doesn’t like it when I update stuff all the time. So when I’m programming I send the changes to test.drfriendless.com.
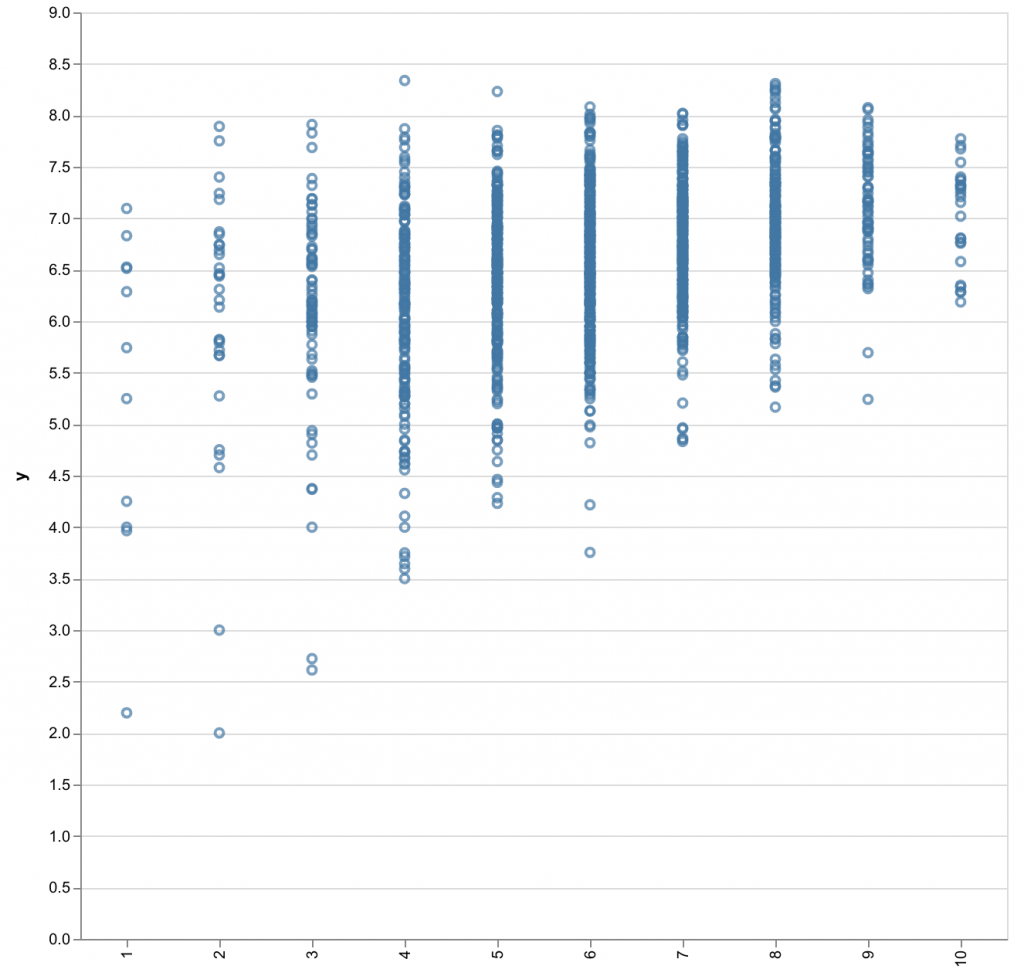
At the top of the table is the Documentation button, where you can find out what the table data is about. So next to that is the Charts button, which reveals more buttons to display charts. When you use one of those, the I give the data from the table to Vega and tell it to draw a chart. Because I’m using the data from the table, there’s no network call related to any of the charts at all, and it’s really quick.
So far there are just 3 charts, because as I was approaching getting them working I realised that I really don’t know anything about Vega. Vega is very clever and very complex, and I haven’t read any of the doco yet. I think I’m off to a good start though!
Of course once I’ve modified the tables so I can hook in the selectors, you’ll be able to control the range of the data. And when I figure out how to work Vega, there should be a huge number of charts to choose from.
I’m very excited. I’d better go read that doco.


